Subject channels in the image to a linear transformation and translation. The matrix is specified as a two-dimensional array with co rows and ci + 1 columns, where ci is the number of channels in the input, and co is the number of channels in the output. The last column specifies the amount of translation.
	matrix := list(.3, .59, .11, 0)
	luminance = rgb cha(matrix, 1, 4)
Power law. The powers for each channel is specified as a tuple. If there are fewer power values than there are channels, the last value is propagated: if there are too many, they are ignored.
 |
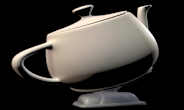 |
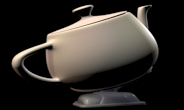
		orig := IceImage With("teapot.tif")
		result := orig Gamma(2.4)
|
|
Note: The Gamma operation does not distinguish between color and alpha channels: nor does it account for premultiplied alpha.
Exponential/logarithmic color correction. These curves yield a more plausible channel-specific brightening/darkening effect. Values represent an amount: negative values are interpreted as a "decrease" and positive ones as an "increase". Useful values are approximately in the −100 to 100 range.
 |
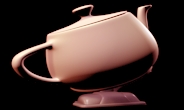 |
		orig := IceImage With("teapot.tif")
		# Boost red
		result := orig ExpLog(list(100, 50, 50))
|
|
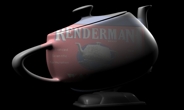
Return an image containing the hue information from the operand, and saturation and value information from the "destination" image.
|
result := tinbox HueCopy(teapot) |
minMax: Minimum and maximum component values. (RealPoint)
Map image through tables with interpolation if necessary. Tables can be specified either as images or as arrays:
- Image: The first scanline is considered the table, and converted internally to floating point values.
- Array: Has as many elements as there are channels: each element is an array of floating point values representing the lookup table for that channel. As always, channels are propagated if necessary and extra channels are ignored.
The pair of values minMax are the minimum and maximum domain values for the tabulated range. The samples in the table are assumed to be equally spaced in the interval (min,max).
Hint: The table version allows different table sizes for each channel: the image version does not.
 |
 |
	i := IceImage With("test.tif")
	// perform on just the red channel
	red := i shuffle(0)

	hist := red histogram(100, list(0,1))

	rhist := hist first
	ogive := List clone
	sum := 0
	rhist foreach(e,
		sum := sum + e
		ogive append(sum)
	)

	total := ogive last
	ogive mapInPlace(i, v, v / total)

	// TableLookup expects a List of List. One List per channel
	lut := list(ogive)
	range :=  list(0, 1)

	result := red TableLookup(lut, range)
|
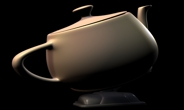
Another interface to Gamma. The specified amount is converted to a gamma value by applying the following equation:
gamma = (amount < 0.0) ? (1.0/(-amount + 1)) : amount + 1.0
The same gamma value is applied to all channels.
 |
 |
		orig := Image With("teapot.tif")
		result =: orig Brighten(0.8)
|
|
fraction: Fraction controlling desaturation effect (Number)
Simulated photochemical overexposure. A fraction of the over-range values resulting from a normal addition is added back to all channels to achieve a desaturating effect similar to that produced by overexposing film. The alpha channel is just copied from the first operand image.